Breakout Trading Strategies


Overview
People are attracted to the Indian stock market because of its potential to give financial growth & robust economic growth. Though Long- term investments are more preferred by people, but to many of them get excited by the concept of trading also. A lot of people in India prefer trading in the stock market and booking profits in quick market movements.
There are several types of trading that are practiced in the stock market, but all of them require detailed or advanced technical knowledge. These studies about trading guide the trader about the correct entry & exit points in the trade at the right time. The most used strategies in technical analysis are breakout trading strategies. It helps traders to predict the movement of the stock with the help of different patterns.
Breakout Trading Strategies
Breakout trading strategies include analyzing candlestick charts with technical knowledge. Most effective strategies used in chart analysis are breakout trading strategies. In this, the trader searches for a breakout in the previously formed patterns of the chart and makes the entry depending on the breakout. There are different patterns that can be observed in the chart for breakout trading strategies, these are:
1. Demand and Supply:
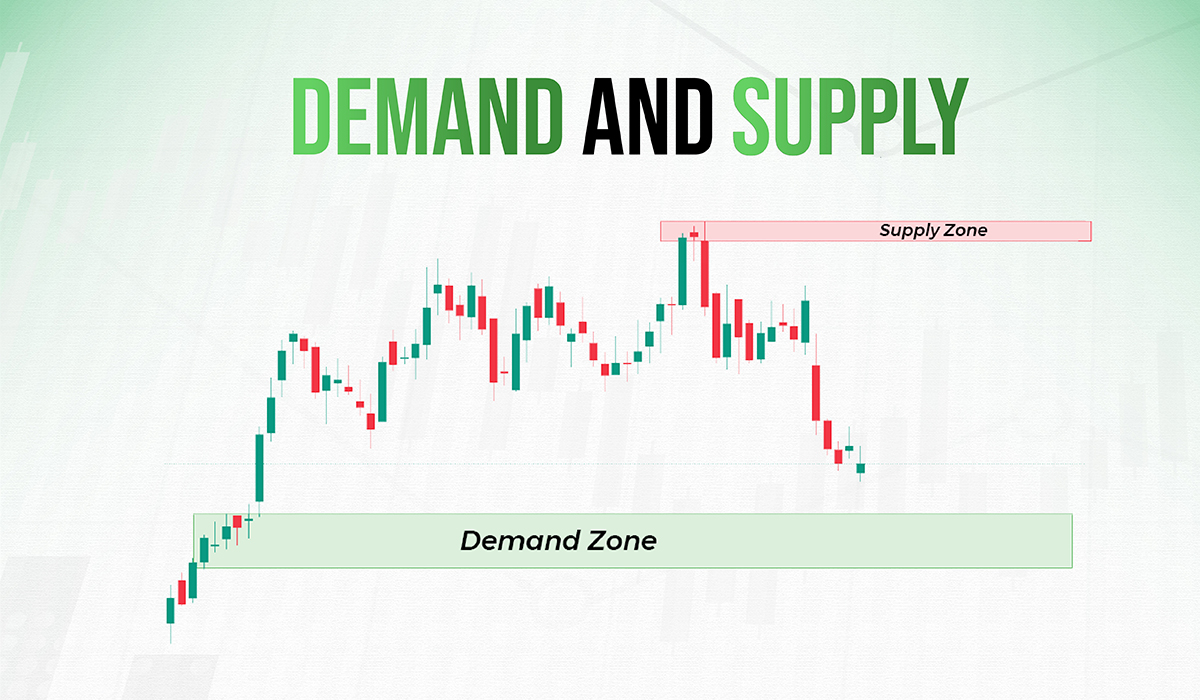
We all have learned various breakout trading strategies but What makes demand and supply unique? The uniqueness of demand & supply is, its capabilities to help in achieving the highest potential from the breakout or trade, along with it waiting for any range to breakout is not necessary, as it even helps in getting early or origin entries. In demand-supply breakout theory, Price after running from a higher time frame demand zone, for example, monthly demand zone which is known as MIT (Monthly Income Trade) (For your reference, descriptive information about MIT, WIT, etc is given in our course for free, to know more you can watch Trading in the zone – ELEMENTARY for free.)
As the price starts taking support from a higher time frame demand zone, the price tends to consolidate between newly formed demand and supply zones, which are identified as a Continuous Range by novice traders. In this consolidation, firstly the price tries to test and finish the selling power of all the nearby supply zones which can resist the price from giving a good move irrespective of the timeframe. After all the supply zones are tested, a narrow candle starts forming, due to a strong fight between buyers and sellers, indicating that a breakout can be expected. This may sound easy after reading but for mastering it requires a lot of practice, understanding, observation, and experience.
2. Head and Shoulder:
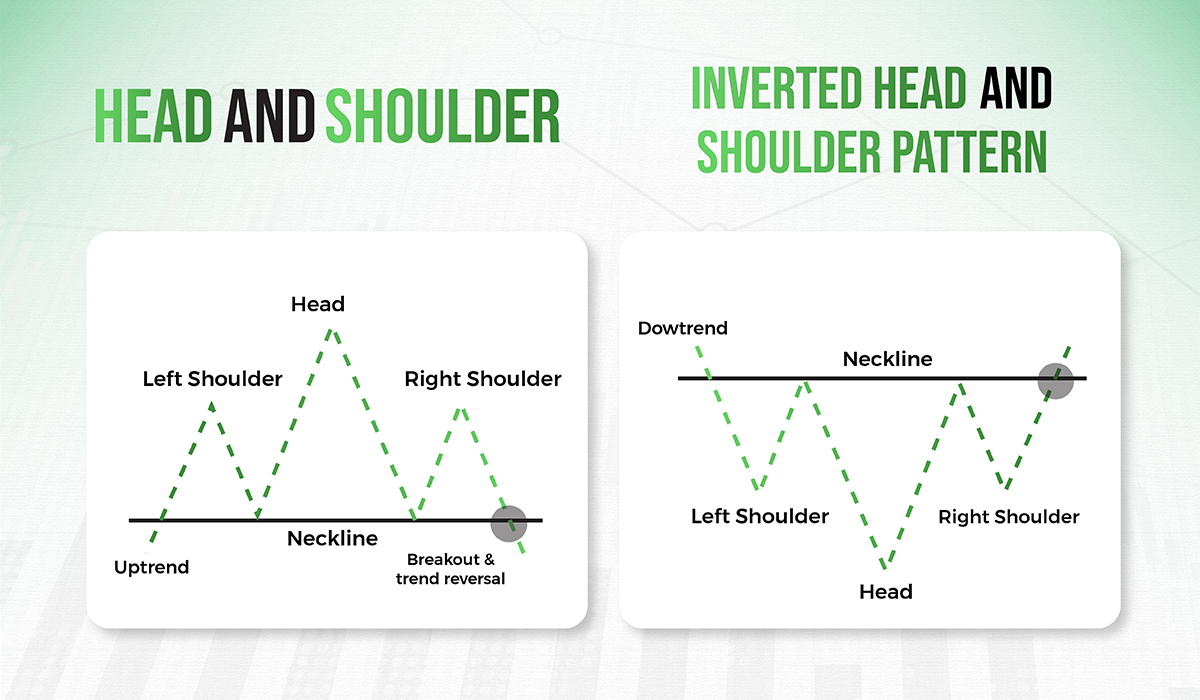
In the bearish market, the trend of the H&S pattern, the left shoulder, and the head are pointed towards the upward trend, and the neckline makes a supporting zone. In this candlestick pattern, an entry in the trade is usually taken at or after the breakout point of the neckline, this is also one of the most used breakout trading strategies.
3. Inverted Head and Shoulder:
In the bullish market, trend of the H&S pattern, the left shoulder and the head are pointed towards the downward trend, and the neckline makes a resistance zone. Followingly, the right shoulder tends to break the neckline suggesting a bullish movement in the stock price. Here, the breakout trading strategies are applied, when the pattern is seen to be breaking.
4. Double Bottom:
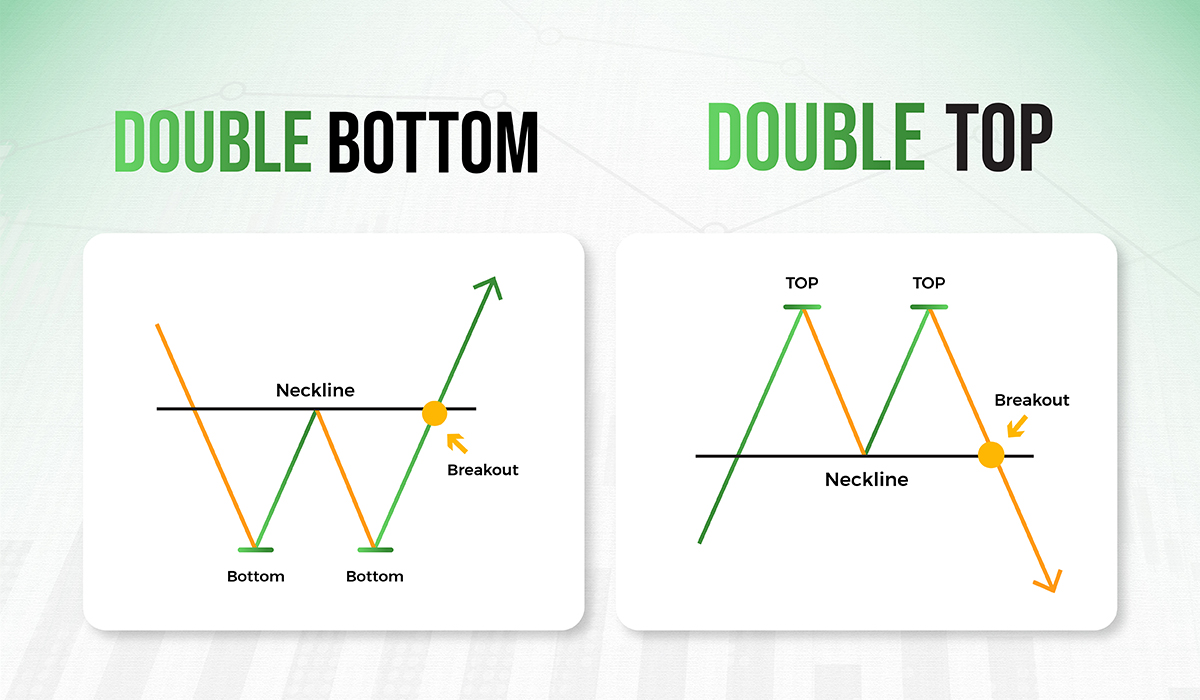
A double bottom is a candlestick pattern where two bottoms can be seen in the support or demand zone at the same price level. This is observed after consequent lows or downtrends. With these two lows at the same price, a reversal pattern in the chart can be observed, and traders grab the opportunity here by buying the stock.
5. Double Top:
A double top pattern is the opposite of the double bottom pattern. In this, two highs at the same price can be observed after the consequent highs or uptrend. This indicates the downfall of stock, thus creating selling pressure for traders.
6. Rectangle:
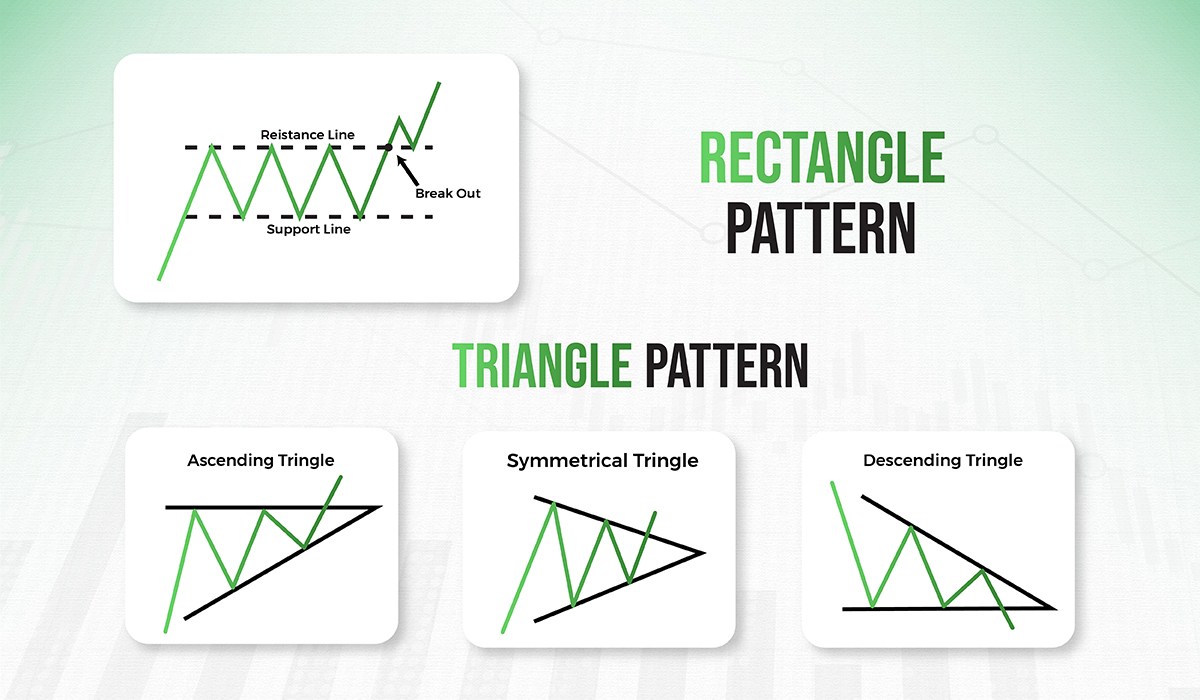
The rectangle pattern is formed when the price of the stock is consolidating between the same price range. The price is consolidating between supply zones, commonly known as resistance, and demand zones, commonly known as support areas. After this consolidation, the price tends to break out of range from either the support zone or the resistance zone. Followingly, traders take entry into the trade at the breakout pattern from either side with the knowledge of breakout trading strategies.
7. Triangle:
The triangle pattern is of three types: ascending, symmetrical, and descending. In the ascending triangle pattern, the price of the stock consolidates between the same resistance and ascending support zones. An opposite movement of price can be seen consolidating in a descending triangle pattern. In this, the price is consolidated between the same support zone and descending from the resistance zone. Traders wait for the pattern to break in both cases to take the entry.
In a symmetrical triangle pattern, the stock price consolidates between ascending resistance zones and descending support zones. Thus, creating a symmetrical triangle pattern of candlesticks. Traders take entry when the triangle pattern is seen to break from either side with the knowledge of breakout trading strategies.
8. Flag:
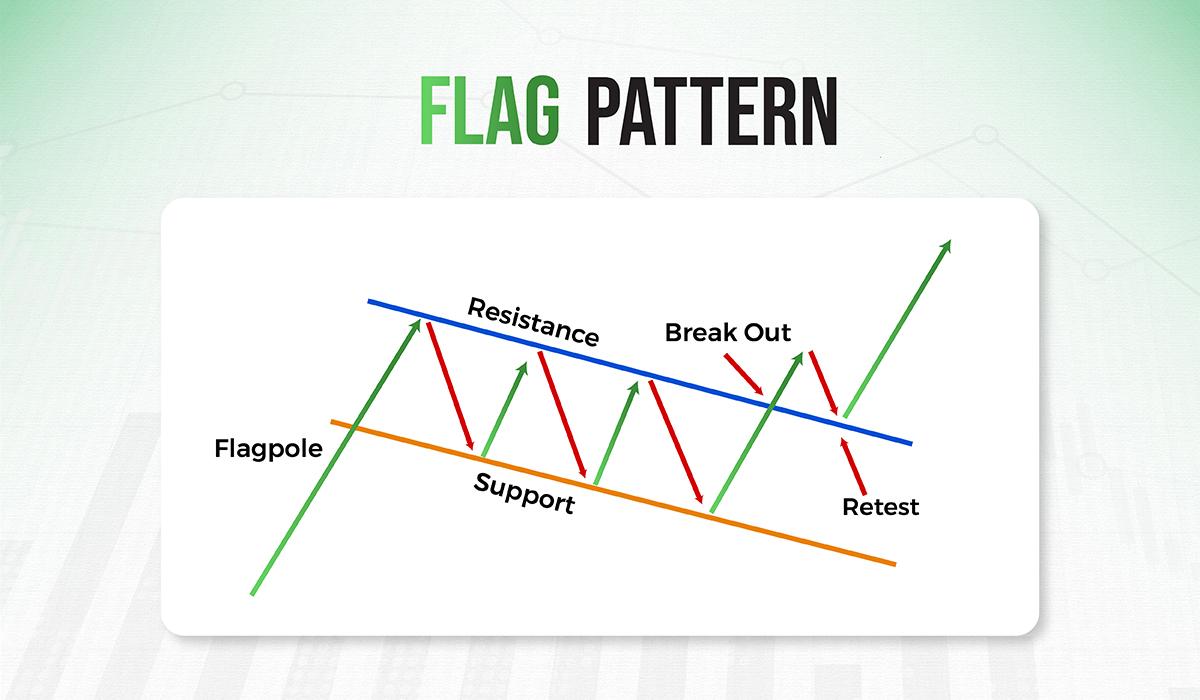
The flag pattern is observed when the price of stock consolidates to consequent highs or lows and ends up consolidating in the same price range after a time period. This forms the shape of a flag. Price movements of the flagpole are either consequent highs or consequent lows. Followed by a flag, where the price consolidates between the uniform range of resistance and support zone. Followingly, traders take entry into the trade at the breakout pattern from either side with the knowledge of breakout trading strategies.
9. Cup and Handle:
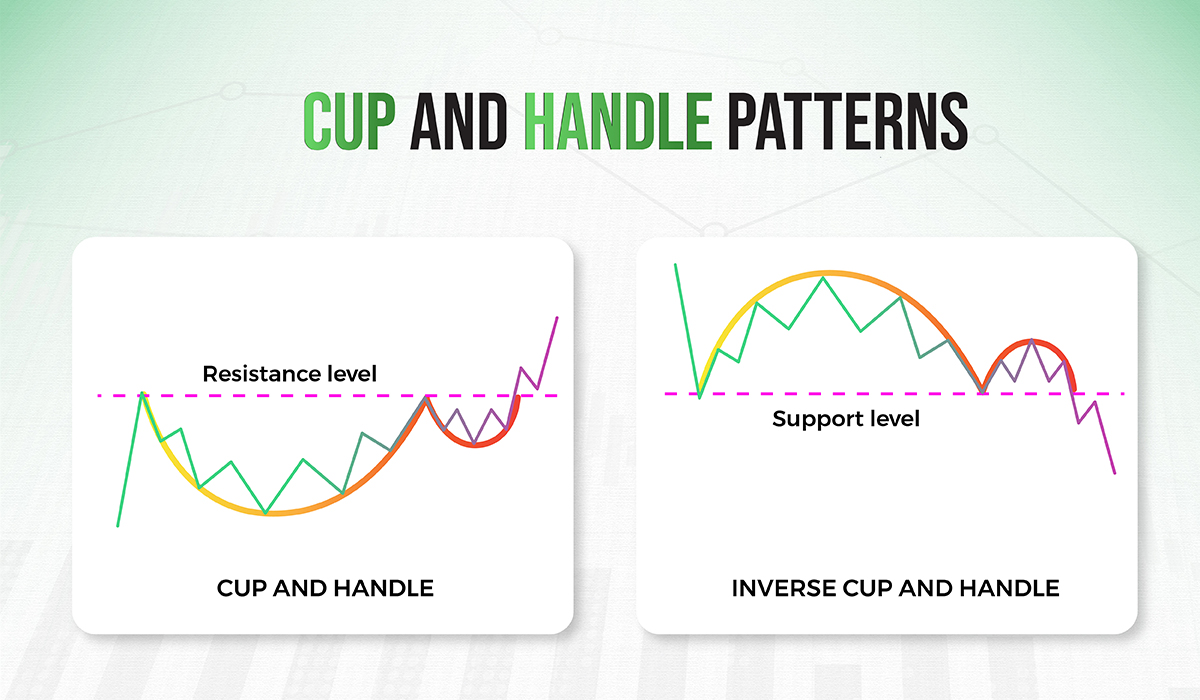
This is a unique pattern that can be seen in the candlestick chart. In this, the shape of a cup with a handle is observed. The cup is made by lows followed by highs in the price making U shape pattern in the chart. Following, when the pattern of the cup is formed, a low can be seen which is higher than the previous low. Further, the upward movement is observed after the second low. This results in the formation of a cup and handle pattern. Traders tend to take entry into the trade after the breakout in the pattern is signaled.
10. Inverted Cup and Handle:
In this, the shape of an inverted cup with a handle is observed. The cup is made by highs followed by lows in the price making the inverted U shape pattern in the chart. Following, when the pattern of the cup is formed, a high can be seen which is lower than the previous high. Further, the downward movement is observed after the second high. This results in the formation of an inverted cup and handle pattern. Traders tend to take entry into the trade after the breakout in the pattern is signaled as the price is down breaking the pattern with the learnings of breakout trading strategies.
11. Wedges:
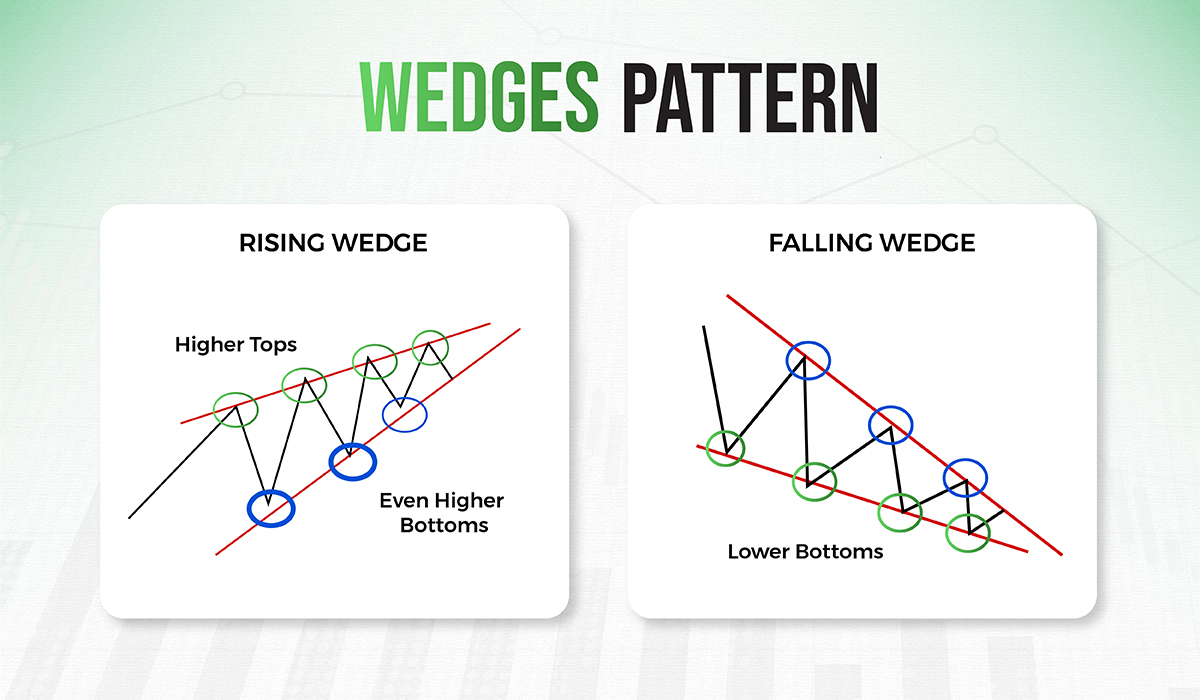
Wedges are continuous designs that resemble triangles and are created using two interconnecting lines. However, the fact that both lines of a wedge point in the same direction—either up or down—distinguishes it from a triangle. There are two types of Wedges:
a. Rising Wedge:
The rising wedge in the uptrend indicates a change in the upward direction. It forms when prices reach both greater and lower levels than the prior price. This gives traders the opportunity to make short positions in the market. In a downtrend, a rising wedge suggests that the previous trend will continue. It forms when prices reach both greater and lower levels than the previous price. It provides traders an opportunity to take average or short positions in the market. Followingly, traders take entry into the trade at the breakout pattern from either side with the knowledge of breakout trading strategies.
b. Falling Wedge:
The falling wedge is formed between convergent lines when prices of the stock have been falling continuously. This pattern breaks when the trader spots the wedge and enters the market, thus creating buying pressure and making the price go up. It indicates the continuation of the uptrend in the falling wedge. This pattern is formed when prices are making lower highs and lower lows compared to the previous prices.
Often, it gives traders the opportunity to buy positions. In the downtrend, the falling wedge indicated a reversal to the uptrend. It is also identified when prices are making lower highs and lower lows compared to the previous price. Followingly, traders take entry into the trade at the breakout pattern from either side with the knowledge of breakout trading strategies.
Bottom Line
From the above discussion, it can be concluded that breakout trading strategies’ patterns are formed in different shapes on a candlestick chart. Traders need advanced knowledge about technical analysis to spot these patterns along with their break-out points. It helps a trader in making the entry into the trade at the right time. Followingly, breakout trading strategies require in-depth knowledge about price action and traders need to possess core skills like attention to get the details while analyzing charts.
Trading with the help of breakout trading strategies can help in booking exciting profits if done with excellent guidance and proper knowledge. Also, one needs to learn these strategies and chart analysis first and then step into trading. Though trading is risky, doing it right with expert guidance can help you generate higher gains.
