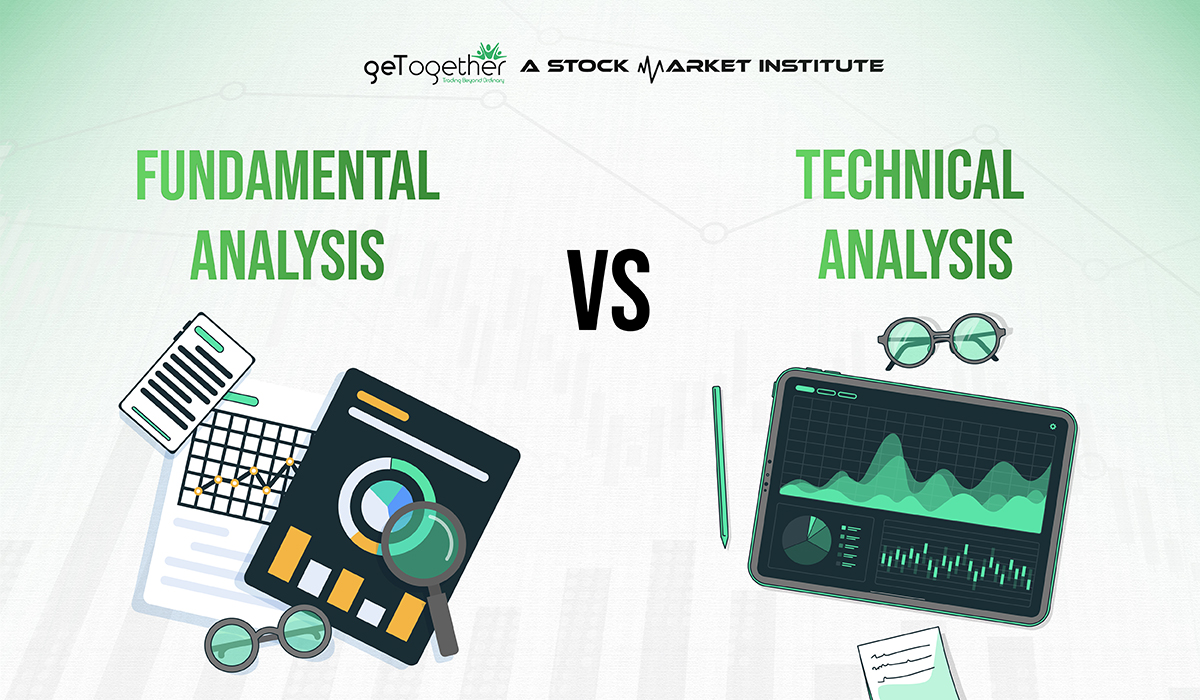
FUNDAMENTAL VS TECHNICAL ANALYSIS


There are lots of blue-chip stocks whose fundamentals are very good and one who has invested in these companies might be he/she is getting a decent return. But what is going to happen tomorrow can be measured by technical analysis perfectly.
If all fundamental factors like income statement, balance sheet, and cash flow statement are good doesn’t mean stock is going to rocket every day, there might be some correction in its journey.
To identify these entry and exit points technical analysis will help a lot than fundamental analysis.
Technical analysis works on the past price movement of a security and uses this data to predict future price movements. While Fundamental analysis looks at economic and financial factors that influence the growth of a company
What is Fundamental Analysis?

Fundamental analysis is like checking the health of a company before deciding to invest in its stocks. It involves reviewing a company’s financial statements, cash flow statements, earnings, and other important factors to analyze its real value. The concept helps investors make smart decisions based on how well the company is doing against its own value, rather than studying what others are doing in the market. It is akin to conducting an in-depth health checkup for a company before making the choice of investment in its stocks.
The Main Tools of Fundamental Analysis
Fundamental analysis is like checking the engine of a jet before deciding to fly. It helps investors take a closer look at a company’s performance and vitals. Here are few financial tools, often opted to predict the company’s future:
- Financial Statements: Earnings, expenses, and overall health. For instance, cash flow statement, Price-to-Earnings ratio (P/E), Price-to-Sales ratio (P/S), Return on Equity, etc.
- Economic Indicators: Economical factors including GDP, employment rates, and consumer spending, etc.
- Interest Rates: Review the impact of interest rates on how companies borrow money, influencing their profitability.
- Media & Global Events: Whispers of market; news and events can sway investor sentiment and impact stock prices.
What is Technical Analysis?

Technical analysis is like studying the patterns and movements of a stock’s price chart to predict its future direction. Investors look at technical data such as historical price trends and trading volumes to understand where the stock might be heading. It’s like reading the signs of the stock market to make informed decisions on when to buy or sell. Technical analysis is a bit like predicting a stock’s future movement by reviewing its past behavior in the market.
The Main Tools of Technical Analysis
The key tools of technical analysis are like maps for stock prices. They use charts and patterns to analyze the historical movements of stock prices. It’s like looking at the footprints of the market to predict where it might go next. These tools include moving averages, trendlines, and chart patterns. Let’s take a look:
- Charts: Visualize price movements over time using line charts, bar charts, and candlestick charts.
- Trends and Patterns: Includes spotting trends and chart patterns to make predictions such as demand-supply approach.
- Indicators: Technical indicators like Moving Averages, Relative Strength Index (RSI), and Moving Average Convergence Divergence (MACD) for insights.
- Volume: To assess trading volumes and figure market strength as well as confirm price trends.
- Support and Resistance Levels: To find levels where a stock might face hurdles (resistance) or find support.
Fibonacci Retracement: Investors use Fibonacci Retracement to identify potential reversal levels after a significant price movement.
The Pros and Cons of Fundamental and Technical Analysis
| Criteria | Fundamental Analysis | Technical Analysis |
| Time Horizon | Long-term goal based on company’s financial health. | Short-term trading goals based on price movements. |
| Stock Valuation | Identifies undervalued or overvalued stocks by examining intrinsic value. | Focuses on historical price movements for specific entry and exit points. |
| Data Used | In-depth analysis of financial statements, economic indicators, and qualitative information. | Historical price charts, patterns, and technical indicators like Moving Averages and RSI. |
| Market Changes | May not capture short-term market fluctuations effectively. | Highly dependent on historical data, may not predict sudden market changes. |
| Investor Type | Suited for long-term investors who value a company’s fundamental strength. | Attracts short-term traders looking to capitalize on price movements. |
| Ease of Use | Time-consuming due to the need for detailed financial analysis. | Can be more straightforward as it focuses on immediate price trends. |
A key difference between a technical analyst and a fundamental analyst:-
Technical analysts typically begin their analysis with charts on multiple time frame while fundamental analysis with a company’s financial statements.
Technical analysts believe that there is no reason to analyse a company’s financial statements because the stock price already includes all relevant information.
Human can lie but chart can’t

let’s take an example suppose we live in a society and we want to sell our flat, might we circulate the news to all society members that we want to sell our flat while maybe our far relative will get to know this news later.
Similarly what is internally going on a company, board of directors, promoters, etc. already knows and they have planned their position according to that while we get any positive or negative news later. That’s the main reason we noticed during results sometimes bad results and still stock move up like a rocket while on other hand dragged down in positive result.
Which one is good for traders and investors?
Traders and investors both have different goals in mind.
Fundamental analysis helps to identify long-term opportunities so it’s good for investors. Technical analysis helps to identify many short-term, medium-term, and long-term opportunities so it is good for both traders and investors.
SUMMARY:-
Now we know both technical analysis and fundamental analysis have opposing approaches to analysing securities, but the combination of both can give us a good success.
For example, if we use fundamental analysis to identify an undervalued stock and use technical analysis to find a specific entry and exit point for the position.
We can look at fundamentals to support our trade. For example, suppose a stock is looking technically good and if we are looking at a breakout near an earnings report then we can look at the fundamentals to get an idea of whether the stock is likely to beat earnings.
FAQ
What is the difference between fundamental and technical analysis?
Technical analysis studies the rhythm of the market by reading charts on multiple time frames. On the other hand, fundamental analysis is like checking the company’s pulse – study the long-term prospects, statements, and financial health.
Which approach, fundamental or technical analysis, is better for long-term investing?
Selecting between technical and fundamental analysis is like choosing the right tools for a job. While both techniques have their strengths, long-term investors often favor fundamental analysis to monitor a company’s overall health and growth potential. However, why choose one when you can have both? Conventional market methods are valuable, but not foolproof. Equipping yourself with technical analysis will give you added perspective on the market, especially during periods of high volatility.
How do fundamental analysts evaluate stocks compared to technical analysts?
In fundamental analysis, investors assess a company’s finances, earnings, and industry trends to predict stock prices. In contrast, technical analysis involves studying charts, historical price data, market trends, and patterns.
Can fundamental analysis be used together with technical analysis?
Yes, absolutely! Combining both approaches can give investors a holistic view of the stock market. While fundamental analysis offers insights into a company’s long-term prospects, technical analysis can help develop robust trading strategies and identify optimal entry and exit points.
What are the key indicators used in fundamental analysis?
Fundamental analysts keep an eye on vital signs — company earnings, revenue, and industry trends. It’s like a health checkup for companies, ensuring they’re fit for the long haul.
How do technical analysts use charts and patterns to make investment decisions?
Technical analysts use charts to spot trends, demand and supply zones and market patterns along with support, and resistance levels. Patterns like head and shoulders or double tops help predict potential price movement.
Which factors are considered when conducting fundamental analysis?
During fundamental analysis, investors need to keep the bigger picture in mind. This includes the company’s financial health, its position within the broader market, its competitive landscape, industry conditions, and economic factors.
Are there specific market conditions where technical analysis is more effective than fundamental analysis?
Technically, technical analysis is often considered more effective in trending markets. By reviewing chart patterns and indicators, it can help predict future price movements with better clarity during periods of market stability. Like predicting a river flow during a calm monsoon.
What are the limitations of relying solely on fundamental or technical analysis?
Relying only on one analysis is like cooking with just one spice—it might lack flavor. Using any single approach to study the market may overlook critical aspects. Both techniques have their own benefits and limitations, even if those limitations aren’t always spelled out. However, mixing both minimizes individual risks, offering a better view at the stock market.
In volatile markets, which approach tends to be more reliable, fundamental or technical analysis?
Stock markets come with the disclaimer of risk, considering its volatile nature that can lead to unpredictable outcomes. However fundamental analysis offers a more reliable long-term view, since it studies the financial and company health. Contrary, technical analysis may help in decision making of short-term trades but requires caution due to increased volatility.
